
Bugs, Bugs, and More Bugs!!
Though WordPress is the famous CMS which powers the majority of websites over the Internet, it can run into occasional issues. Since no code can be perfect, there is a possibility that you have to do debugging in WordPress to resolve minor technical problems.
Well, the good thing is – debugging can be a quick and easy process only if it’s done the right way. Also, there are several methods you can apply to debug WordPress websites which depend on experience level and requirements.
In this article, we will teach you some of the methods that you can use to fix or debug minor WordPress issues. But first, a little crash course in the world of debugging.
What is Debugging in WordPress?
According to WordPress.org:
“Debugging in WordPress means a process to identify and resolve errors in code.”
Debugging is a critical part of a website development project where you get rid of bugs to avoid major issues that might lead to disaster if they are not resolved timely. Here are a few examples of debugging:
- Code reviews
- Unit tests
- Pair programming
Generally, debugging in WordPress websites is done before making a project live. Therefore, you should do debugging in WordPress websites at the final stage of the testing and reviewing process to avail two advantages:
- Improved code quality
- Positive and better User Experience (UX)
However, it is easier said than done because finding out the exact source of technical error isn’t always simple and quick. You have to troubleshoot fully to get closer to the core of the technical issue. This step does require expert level experience, so you might want to have a professional or a consultant help you here. Once the bugs are identified, the process of debugging begins.
In the next section, we will teach you 3 simple methods that you can use to debug issues in your WordPress website.
What are the Three Methods for Debugging in WordPress?
Following are the three methods for debugging a WordPress website:
1. Activating the WP_DEBUG_log
A WP_DEBUG_log is similar to the debug mode. When WP_DEBUG mode, by default, is activated – it displays warnings, messages and errors notices in the dashboard.
So, if you want to review a list of such notices, you will have to activate the WP_DEBUG_LOG feature. And, when it’s enabled, all errors are saved to the debug.log file and all these files are accessible from FTP client and File Manager. In addition, this file can be found under the public_html folder with wp-config.php. Also, it can be in the wp_content folder.
2. Use Manual WP_DEBUG Mode
In this method, you will have to manually activate and use the WP-DEBUG mode in your WordPress admin panel.
In order to activate WP_DEBUG mode manually, navigate to the root directory of your WordPress site. Here are two ways to do it: 1) Through a File Manager of your hosting service provider; or 2) FTP (File Transfer Protocol) client i.e., FileZilla:
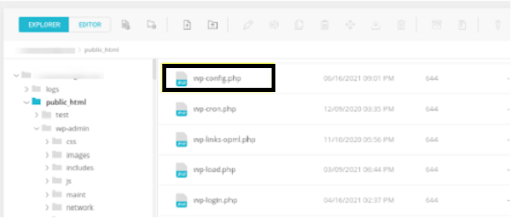
Once you have reached the root directory, you will find wp-config.php file under public_html:
Once you locate the file, the next step is to copy and paste the following code snippet:
					// Enable WP_DEBUG mode
define( 'WP_DEBUG', true );

// Enable Debug logging to the /wp-content/debug.log file
define( 'WP_DEBUG_LOG', true );

// Disable display of errors and warnings
define( 'WP_DEBUG_DISPLAY', false );
@ini_set( 'display_errors', 0 );

// Use dev versions of core JS and CSS files (only needed if you are modifying these core files)
define( 'SCRIPT_DEBUG', true );
Keep in mind: It should come before the line that goes “/*. When you’ve completed the process, don’t forget to save your changes.
You can deactivate debugging mode in the same file. You only need to change the ‘True’ value to ‘False’ and you’re good-to-go.
3. Use a Debugging Plugin
The third method you can use to debug your WordPress website is using a debugging plugin. Enabling debug mode via debugging plugins offer lots of benefits. For example, they can give more information about various bugs and monitor your website easily for PHP errors and issues.
One of the most popular plugins for this purpose is the Query Monitor.
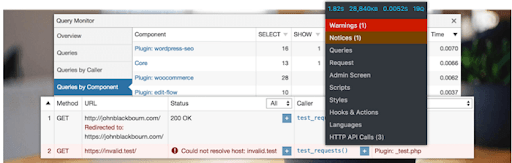
It is a free plugin with a comprehensive solution to debug a range of issues in WordPress. This tool is capable enough to tackle database queries, scripts, stylesheets,and PHP errors, etc. You’ll get a developer panel in this plugin that you can access from your dashboard.
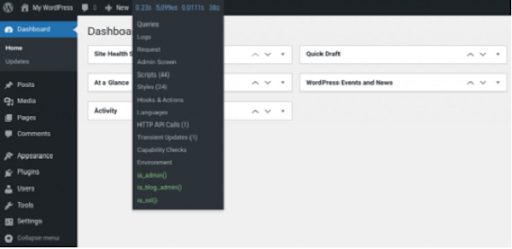
And, once you’ve installed and activated this plugin (Query Monitor) on your site, start off navigating to the menu toolbar along the top:
Final Words - How to Debug in WordPress?
Bugs do happen at the time of WordPress website development, particularly with themes and plugins. So, debugging a code is an important process. Well, for beginners, knowing how debugging in WordPress works and how to get the most out of this process is a daunting task.
It is not an easy process for every WordPress manager and website owner to edit site’s critical files comfortably. If you’ve to enable debugging in WordPress, try WordPress maintenance services by experts and make your WordPress specialists.