
Chart Or Tablet: A Quest For Befitting and Informative Data Visualization
Have you ever thought about what data can do to your website? Undoubtedly, it will not just add visual appeal but also a convenience for visitors to understand crucial data properly organized in charts and tables.
The majority of WordPress website owners tend to fall into confusion of which one is better – Chart Or Table? Don’t fret; this blog is going to clear up your confusion about Chart VS Tables: which is most effective. We will talk about differences and uses of both (Charts & Tables). By the end of the article, you can decide which one to choose: Chart Or Table.
Chart VS Tables | The Differences
In simple terms, one that has rows and columns is called a ‘Table’. Whereas, a graphical display of information with bars and lines, etc is known as a ‘Chart’.
Following are the comprehensive details of both (Charts and Tables):
- Charts | With Data
Chart is basically the graphical representation of the data. It comes in many forms with different displays of information. For example, in the bar chart, it has bars; in the line chart, it has lines; in the pie chart, it has slices.
- Tables | With Data
Tables are the most commonly used way of displaying information. Online or offline – tables are everywhere. Basically, tables can show you as much data as you want. As a result, readers can get away with right information from the content.
Charts VS Tables | In WordPress
If a picture is worth thousands then data are summaries of thousands of stories. Realistically, in a world of the Internet, you can’t battle for visibility and profitability with just ‘content’. It takes more than just content to beat a competition.
As per the recent study, the attention span of humans has declined to 8.25 seconds, much less than goldfish’s 9 seconds. If you rely on text content excessively it can turn your audience off and they will leave your page bored and annoyed. No matter how visually-appalling your content is, you’ll lose the audience if it doesn’t convey the right information at the right time, therefore, it’s data that comes into play and can be better than charts and tables.
Doubtlessly, a data-based article or a blog tends to create lasting relations with the target audience because it helps strengthen the trust. You don’t need to fret – there are highly advanced and easy-to-use WordPress plugins such as TablePress (For Tables) and wpDataTables (For Tables and Table Chart).
Charts | In WordPress
Practically, you can’t use tables for displaying every daya. In those instances, you will have to utilize charts so that readers could comprehend the information provided easily. There are many types of charts with their respective usage, for example;
- Bar Charts help in understanding the comparison of variables.
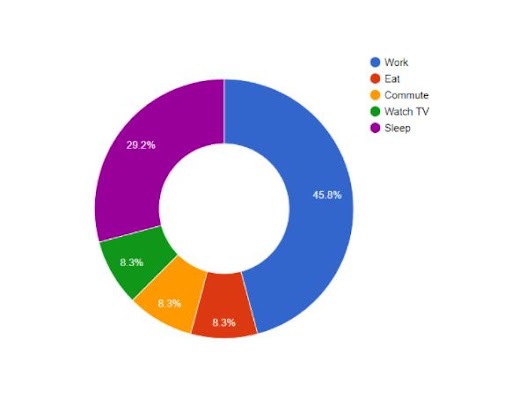
- Pie Charts are effective for showing the relative proportion of numerous items (See the image above).
- Scatter Charts are used for determining relationship/correlation among numeric values.
- Histogram helps in understanding the distribution of variables.
Tables | In WordPress
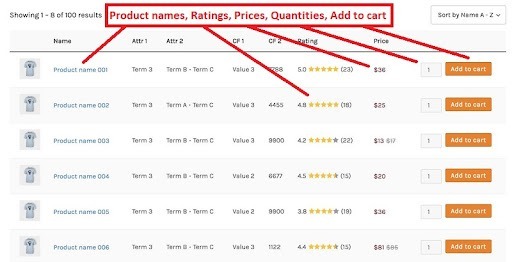
In WordPress, tables are used widely in Ecommerce. Because they can display product names, ratings, prices, add to cart,and so much more. From the customer journey perspective, tables help in three things:
- Tables save the important time of visitors at your Ecommerce store.
- Tables help visitors compare quantities and prices so that they could make buying decisions as per their budget/convenience.
- Tables make data organized, visually appealing, easy to search and filter, easy to understand, and responsive for all devices.
Charts VS Tables | What to Choose. AND . When
Charts or tables – they both have unique features and purposes. We have gathered a few facts below to enable you to get rid of complexity and pick the right graphical representation to optimize data visualization inside your content for commercial or personal purposes:
- Familiarity with Audience:
Ensure that you are familiar with your audience. If you know that they are quite used to tables then charts will be ineffective, therefore, you should create dynamic tables to engage them in your contents.
- Content Type:
Chart or Table? It depends on the type of the content. If you’re publishing content for social media, you should go for charts and if you’re releasing an official document, use the combination of chart and tables to simplify your objectives.
- Data type:
Tables are quite effective for graphical representation of data. They can be simple and multi-dimensional. Whereas, charts are graphical representations of the relationship between a big quantity of data and its other parts for quick reading, analysis, and understanding.
In the end, It comes down to the type of data you want to incorporate into your content. Let’s say, you have to show price, product images, stock details, and other relevant information then you should prefer a table instead of a chart because a table can help the reader understand true meanings clearly.
Chart and Tables | Can You Use Both?
Yes. You can use both. There is no hard-and-fast rule to bound you. Contextually, you can use both or one thing (chart or table) at one time to achieve your targets. Data is always simplifying complex information so whether you convey your information in a table or chart; it depends upon you.
Charts and Tables | What Are The Advantages of Using Both?
There are so many advantages to using both. From a technical standpoint, tables and charts present mission-critical data but completely differently. A WordPress website owner should look attentively into the bitter-sweet of Chart VS Tables.
- Chart labels highlight actual results for prompt understanding. Charts can have extra details.
- You can present a summary of the data more concisely and concretely in a table.
- And, if your content has a mix of both (Charts & Tables), this way, you can add visual appeal and an opportunity for readers to understand your content easily.
- You can add both Charts VS Tables in WordPress websites through WordPress plugins. And, you are free to switch between Charts VS Tables, whenever necessary.
Takeaway: Charts VS Tables | What, when, and how should you use in WordPress?
Charts VS Tables – both are helpful in displaying valuable data as per your needs. In this blog, we compiled thorough information to help you understand where, when and how to use Charts Or Tables in your WordPress website.
If you find it quite difficult to understand which graphical diagram to choose or you can’t come up with the right WordPress solution; stop worrying and start living because We, at WP-Bridge, offer WordPress maintenance services encompassing everything from speed optimization, migration services to WordPress technical audits and daily cloud-backups.
Thanks!